A new tool for understanding kelp decline and its impact on B.C. coastal habitats has been developed by combining old naval charts with the latest satellite data.
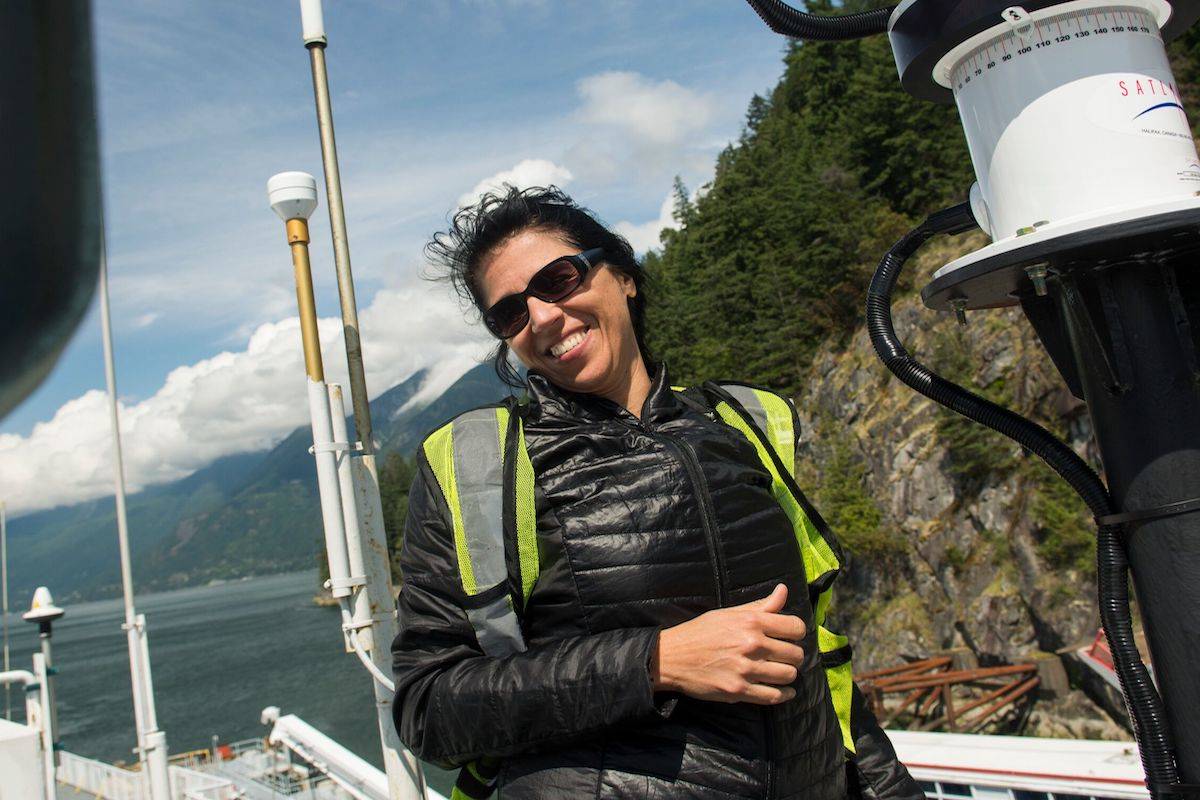
Maycira Costa, a professor in the University of Victoria’s geography department, was in a colleague’s office when she noticed a beautiful old nautical chart on the wall from 1903.
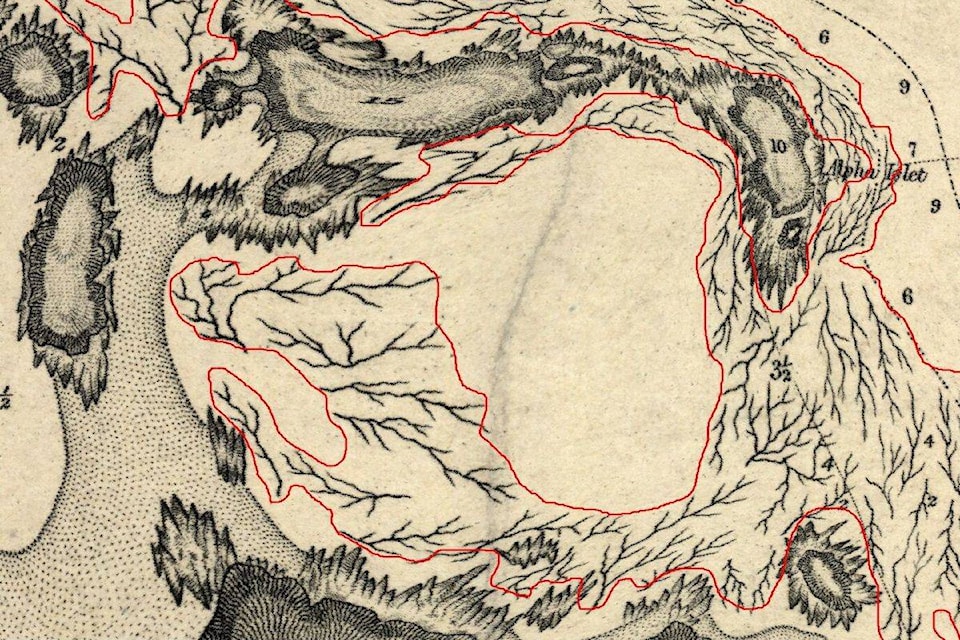
“As I looked I saw drawings of plants on the coast. I have a separate satellite project and realized the areas on the map were the same as the satellite pictures.”
The British Navy of the late 19th century was famous for its fastidious mapping, and they mapped kelp beds extensively as they presented a hazard to shipping. Costa realized the old maps were a potential gold mine of valuable data.
“I said, ‘Wow that’s amazing. Can we find maps for the whole Canadian coast?’”
Costa contacted the Canadian Hydrographic Service, who fortuitously had similar ideas, and were busy scanning and making digital copies of all the B.C. coastal charts they could find.
The process took several months, but at the end of it, the researchers were able to assess the accuracy of the maps.
They found that the maps were generally accurate and presented a viable baseline of data they could work from. Costa said modern biometric data shows that B.C. kelp beds run to a maximum depth of 30 metres. The British were known to get depth sounds and so when the researchers saw the British had noted kelp depths of 20 to 25 metres they knew the beds were likely to have been correctly recorded. Anything noted as deeper than 30 metres were not considered reliable.
ALSO READ: ‘Snow, melt, freeze, snow, melt, freeze’ leaves daffodils unpicked on the Peninsula
The researchers used British Admiralty charts from 1858 to 1956 and the maps were so accurate, later generations of maps built on the work of earlier cartographers and presented an accurate snapshot of kelp beds over the 100 year period.
Once the maps had been checked, modern satellite images of the same coastline were transposed over them, showing the differences in coastline and kelp beds.
Asked whether the maps hinted at any sunken treasure galleons, Costa laughed and said, “No sunken treasure ships but it was interesting as some features of the B.C. coastline didn’t match.”
She said that either there were errors during mapping or the maps could show sea level rises, erosion and sediment deposits over the generations. This is currently being studied.
ALSO READ: Groups target Health Canada approval of weed killer
The old nautical charts have proved especially helpful as they present an almost complete picture of kelp beds from their time, while there is currently no modern B.C. kelp bed map.
Costa has been part of a study that monitored kelp beds in Cowichan Bay from 2004 to 2017. During that time she has seen the kelp beds decrease and recover with fluctuating water temperatures. The new data, allied with this study should provide a more complete picture of a fragile ecosystem that is critical to species such as salmon and herring.
Costa said she enjoyed the novel way of collecting data, “We use high-tech satellites 700 kilometres above the earth’s surface, but then I get excited when I see the old historical charts and hold them in my hands.”
nick.murray@peninsulanewsreview.com
Like us on Facebook and follow us on Twitter